Unit 10 – Brief 3: My Message to Society – Research: Maps
“I am told there are people who do not care for maps, and I find it hard to believe.”
—Robert Louis Stevenson, Treasure Island
map noun


A map is a visual representation of an area – a symbolic depiction highlighting relationships between elements of that space such as objects, regions, and themes.
Many maps are static two-dimensional, geometrically accurate (or approximately accurate) representations of three-dimensional space, while others are dynamic or interactive, even three-dimensional. Although most commonly used to depict geography, maps may represent any space, real or imagined, without regard to context or scale; e.g. brain mapping, DNA mapping and extraterrestrial mapping.
Maps are quite interesting historically, they show a lot about how people perceived the places where they lived. I remember that I wrote about this briefly within my dissertation;
Joyce’s writing looks at standardisation and creation of systems. An example of a standardised system in relation to mobility and movement is mapping. Joyce refers to the modern map as a standardised representation of an abstract space.
“[The modern map] measured against an abstract grid of space, what
was represented – towns, streets, coastlines became essentially one. This standardisation of space was further accentuated by the increasingly sophisticated printing of maps, especially in the ninetieth century.” (Joyce, 2003, p.36) Creating maps of the city formed a classification system
of roads and streets; this system ordered how places related to each other. Mapping documented and removed places. By generating a visualisation of the city it was a way of controlling peoples movements, as the routes are predetermined.Systems
Another writer who looks at structures, specifically grids and how they affect society is Hannah B. Higgins. Higgins states within The Grid Book that the “modernist grid is an emblem of industry. It reflects standardi- sation, mass production, and the newly smooth mechanics of transportation.” (Higgins, 2009, p.6)
This connection created by Higgins is the link between Joyce and Virilio’s theories on movement and its implicit relationship to modern society.
Higgins suggests how individual grids connect to each other and how these connections provide an underlying framework for a modern society.
“They do not, however, evolve in isolation. Rather, the quality of each grid progressing to the next ties them to political, social, economic, and religious histories, each grid aligning with a different universalizing scheme.” (Higgins, 2009, p.8)
Grids are seen as a tool for organisation and standardisation. For example a city is usually formed on a disguised grid system that subsequently dictates the movement of people. The popularity of systems within the industrial revolution allowed for grids as an organisational tool to define space and time as well as prosper in visual culture.
When you create a map, what you miss out is just as important as what you keep in. Similar to what I was talking about within my dissertation is this article by Paula Scher which can be read in full HERE

But my father told me that the map was distorted. He pointed out its discrepancies: an inaccurate curve of the roadway here, a shadow that blocked the proper view of our shed there, a foreshortening of Oakview Drive. I thought he was nitpicking, but he insisted that these kinds of distortions cause all kinds of problems for people building houses, roads, and bridges. “All maps are distorted, they are not literal fact.” He tried to explain lenses and what caused distortion in aerial photography. I didn’t understand him at all.
…
Years later, as a young adult, I began working as a professional graphic designer. My job was (and still is) to organize and layout other people’s information. I am completely aware of the distortions that can inadvertently occur in the process of editing, designing, and publishing texts. Articles are cut to fit into specific formats, and sometimes the cuts alter meaning. Hierarchies are created to help readers navigate texts, sometimes distorting the emphasis of specific content. Pull quotes (those sexy excerpts from an article that are blown out of scale to entice readers) can mislead by making the article appear to be about something different. Info graphics make an opinionated article appear scientific, and are more and more frequently appearing as unbiased stand-alone data, often disguising the dogmatic intent of an author. To make matters worse, the blogosphere completely democratizes such distortions. Anyone can make them, and they do.
The London Underground Map
When I think of Maps, the London Underground is probably the one I think of instantly. It is clear and easy to read. However I have some seen some interesting alternatives.

The striking Tube map that is recognised across the globe was the brainchild of Underground electrical draughtsman, Harry Beck, who produced this imaginative yet stunningly simple design back in 1933.
Beck based the map on the circuit diagrams he drew for his day job, stripping the sprawling Tube network down to basics.
The result was an instantly clear and comprehensible chart that would become an essential guide to London – and a template for transport maps the world over.
Beck’s revolutionary design, with certain modifications and additions, survives to the present day and is set to serve London Underground and its millions of customers for many years to come.

Max Roberts, expert on underground maps, has designed this new way to look at the London tube map. The commonly used map of the London Underground is becoming even more cluttered, hence this new circular approach. HERE
Really interesting take on the London underground, considering we always refer to the middle part as Central London, it makes it perhaps more logical to see it as a circle.

Map of London on Glove for the Great Exhibition of 1851, George Shove ca. 1851
Printed map on leather
This item that will intrigue both fashion and map aficionados is a map of London on a glove created for the 1851 Great Exhibition (a.k.a. the First World’s Fair). The Victorian lady who owned this glove would have Hyde Park in the palm of her hand and the River Thames wrapped around her little finger.
( How to design a transit map HERE )
Edward Tufte – Pioneering information design as well as data visualisation.

Below are his rules in terms of what constitute to making a well designed map. He also coined the term CHARTJUNK – Useless information that does not aid the reader. I feel very strongly about unnecessary details when designing therefore understand and agree with Tufte’s opinion. – Relates to the ideas at the beginning of my dissertation – Adolf Loos and Ornament is crime!
The interior decoration of graphics generates a lot of ink that does not tell the viewer anything new. The purpose of decoration varies — to make the graphic appear more scientific and precise, to enliven the display, to give the designer an opportunity to exercise artistic skills. Regardless of its cause, it is all non-data-ink or redundant data-ink, and it is often chartjunk.
20 Tufteisms from The Visual Display of Quantitative Information
- Graphical excellence is the well-designed presentation of interesting data – a matter of substance, of statistics, and of design.
- Graphical excellence consists of complex ideas communicated with clarity, precision, and efficiency.
- Graphical excellence is that which gives to the viewer the greatest number of ideas in the shortest time with the least ink in the smallest space.
- Graphical excellence is nearly always multivariate.
- Graphical excellence requires telling the truth about the data.
- The representation of numbers, as physically measured on the surface of the graphic itself, should be directly proportional to the numerical quantities represented.
- Clear, detailed, and thorough labeling should be used to defeat graphical distortion and ambiguity.
- Write out explanations of the data on the graphic itself. Label important events in the data.
- Show data variation, not design variation.
- In time-series displays of money, deflated and standardized units of monetary measurement are nearly always better than nominal units.
- The number of information-carrying (variable) dimensions depicted should not exceed the number of dimensions in the data.
- Graphics must not quote data out of context.
- Above all else, show the data.
- Maximize the data-ink ratio.
- Erase non-data-ink.
- Erase redundant data-ink.
- Revise and edit.
- Forgo chartjunk
- If the nature of the data suggests the shape of the graphic, follow that suggestion. Otherwise, move toward horizontal graphics about 50 percent wider than tall.
- The revelation of the complex.
Another system / check list that looks at the elements when creating and design a map HERE
Also another list of design principles when creating information design;
- Simplicity: Systematic reduction of the information to be conveyed
- Coherence: Defined shape and structure
- Balance: Clear definition of focal points and appropriate graphic density
- Harmony: Visual refinement
- Topography (Credibility): Low conflict with expectations
- Supplementary information: Low quantity, high quality
Full Article by Sheila Pontis HERE
Amazing blog about information design!
This isn’t a lesson in cartography, but understanding the purposes that maps can serve in modern Web design is important. Three main areas seem to represent the majority of tasks:
- Navigation and directions,
- Show relationships and trends geographically,
- Show points of interest.
Types of Maps

Time Line – Used to communicate other informations, social or culture changes. Maybe even physical changes in the land shape.

Zoom – Physical geometric map.

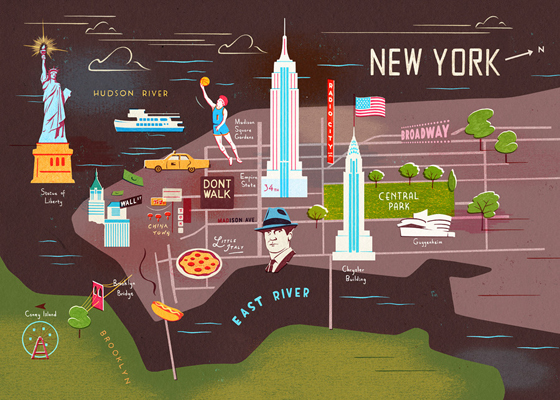
Point of Interest – When navigating a place that you may already be familiar with or planning to visit. This maybe the type of map I am needing to create. However, the phone signal is needed to be full strength.

As an Informational Tool – Helpful when looking to find out more information rather than just geographical location.

Information from political votes. Maps out voters locations and also gives an idea to who may win as well as the kind of voters are within the state.

Unconventional Map – Abstract verging on information design, no real physical location. Taking the idea of maps in term of relating one thing to another.
User Responsive Maps – Mapbox


Interesting where people can make personalised maps, they can decided what is important to them such as places of interest of perhaps just A roads, where they wish to drive and avoid B roads.

1982
Printed map
Though today we all turn to Internet for our mapping needs, only 25 short years ago this is what the Internet looked like. In 1982 the Internet consisted of only 88 computers, linked as shown in this diagram-like map.
Maps on small scale – Within a building
I have looked at maps generally, but my mapping system will be on smallish scale, within a single building, and I am still undecided whether I focus on one floor and area rather the entire building. When looking at maps for small scale locations. They generally look quite similar. Very geometric and structures, clear lines and 90 degree angles.


Other Visual research when looking for maps

A doodle project to document another city. Form of mapping.
Tokyo by Richard Saul Wurman, 1984

Firstly, this is not a map of the Tokyo subway, as many commentaries that I have come across state. It actually shows two lines of the JR East rapid transit network that very cleverly help to define “Tokyo”: the circular loop Yamanote Line, and the cross-town Chūō-Sōbu Line. The stations along the Yamanote Line all have points of interest listed, while the Imperial Palace complex is shown for reference within the circle.


Maps… But not in the traditional sense. Information design is also known as information architecture.